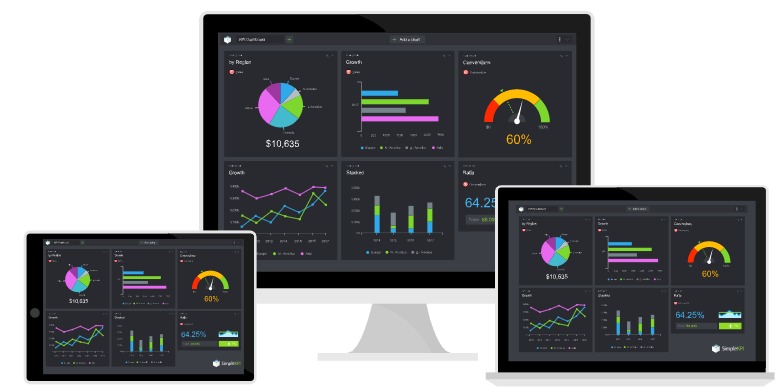
Executive Dashboard
With DynamicEA, you can empower your team with data insights in real-time, cloud-based dashboards.
Executive dashboard deployment by collecting data by system or Location. Objective is to show high-level monitoring through dashboard. It is one stop monitoring of whole plant.
- Real-time dashboards (reading from Instruments, others)
- Historical Data
- PieCharts, Charts, tools
- Alarm Notification
- SMS Notification
- Email Notification
- High End Graphics
Types of Executive Dashboards
All executive dashboards provide a high-level view, but it’s also important to be able to take a deep-dive to understand data and how to make corrections to improve results. So, what do dashboards look like? And how do they work in specific use cases?
CIO Dashboard
Information technology executives can get an accurate, consistently up-to-date overview of their entire IT portfolio at a glance. You can see if the current portfolio spend is aligning with strategic objectives,where the money is being spent, and get a true check on the health of the portfolio and see upcoming major milestones.

Finance Dashboard
CFOs and other executives who need quick big picture financial summaries can get them via a dashboard. In a glance, you can see if you’ve reached targets, where you need to check on negative trending, and easily link to more granular information around individual team member status and performance. On one page, you can access the fiscal performance data you need to understand how you can grow profitability—or proactively address issues—that affect your bottom line.

Human Resources Dashboard
Track all HR activities, projects, and timelines—in real time—from a centralized hub. With one view of all HR activities, you can check hiring status, onboarding procedures, employee programs and how much your department is spending. News feeds give you easy access to the latest information with quick links.

Operations Management Dashboard
Managers at every level can stay on top of operations to track if you’re on schedule, if staff is on track to complete tasks, if you’re on budget, and more. You can provide access to important documents, make sure the team knows about upcoming events and dig into details to see where process improvement can be made.

Project Management Dashboard
Program and project managers can stay on top of individual or a combination of programs, or dig into the details of an individual project on an as-needed basis. This type of dashboard gives you visibility into all projects in the program and track how they’re performing; an at at-a-glance view of program-level performance metrics, access program documents and various workspaces, and allow a deep dive into detail with just a few clicks.

Sales & Marketing Dashboard
Sales and Marketing executives have high-level or detailed visibility into the sales activities and progress they need to track sales pipeline activity, key metrics, and status. They can also analyze metrics in a number of ways: by pipeline stage, product line, or sales rep to look for any potential weaknesses or strengths. To set up for future success, one click opens up every opportunity in the pipeline.

Selecting the Right Dashboard for Your Needs
As organizations drive to be ever-more nimble, executive dashboards are used by many different kinds of managers. This trend reflects the realization that faster decision-making speeds success by empowering managers to make their own decisions in response to opportunities.
While there are three overall dashboard styles: strategic, analytical, and operational, executive dashboards are strategic by definition. Many executives choose to use a hybrid of two or three so high-level information can be explored via drill-down, to pinpoint ways to improve performance and transform numbers into action.
- Strategic (executive) dashboards show birds-eye-view visualization based on KPIs. They are linked with balanced scorecard strategic planning and management systems methodology that aligns business activities to the vision and strategy of the organization, improve internal and external communications, and monitor organization performance against strategic goals.
- Analytical dashboards offer drill-down functionality to explore data in a granular way and should be accessible to executives and managers. Analytical dashboards can be more complex than strategic or operational dashboards because they focus on gaining insights from a large volume of data collected over time. This data is used to understand what happened, why, and what changes should be made in the future. This kind of business intelligence can used by executives and teams to support decision making.
- Operational dashboards display real-time data to help manage daily business processes, and are commonly used by department managers and front-line employees who need to know and act on opportunities and issues ASAP. For example, sales departments may track the number of units sold daily, help desks may use them to understand the types of queries to help better design user information and products, and marketing to see the results of current campaigns.
Once you’ve determined the depth of information you need to access, and which team members will have access or own their own dashboard, what is the right framework to begin development?
Platforms include:
- SmartSheet
- DOMO
- Tableau
- Grafana
- Thingworx
- iDashboards
- AngualrJS